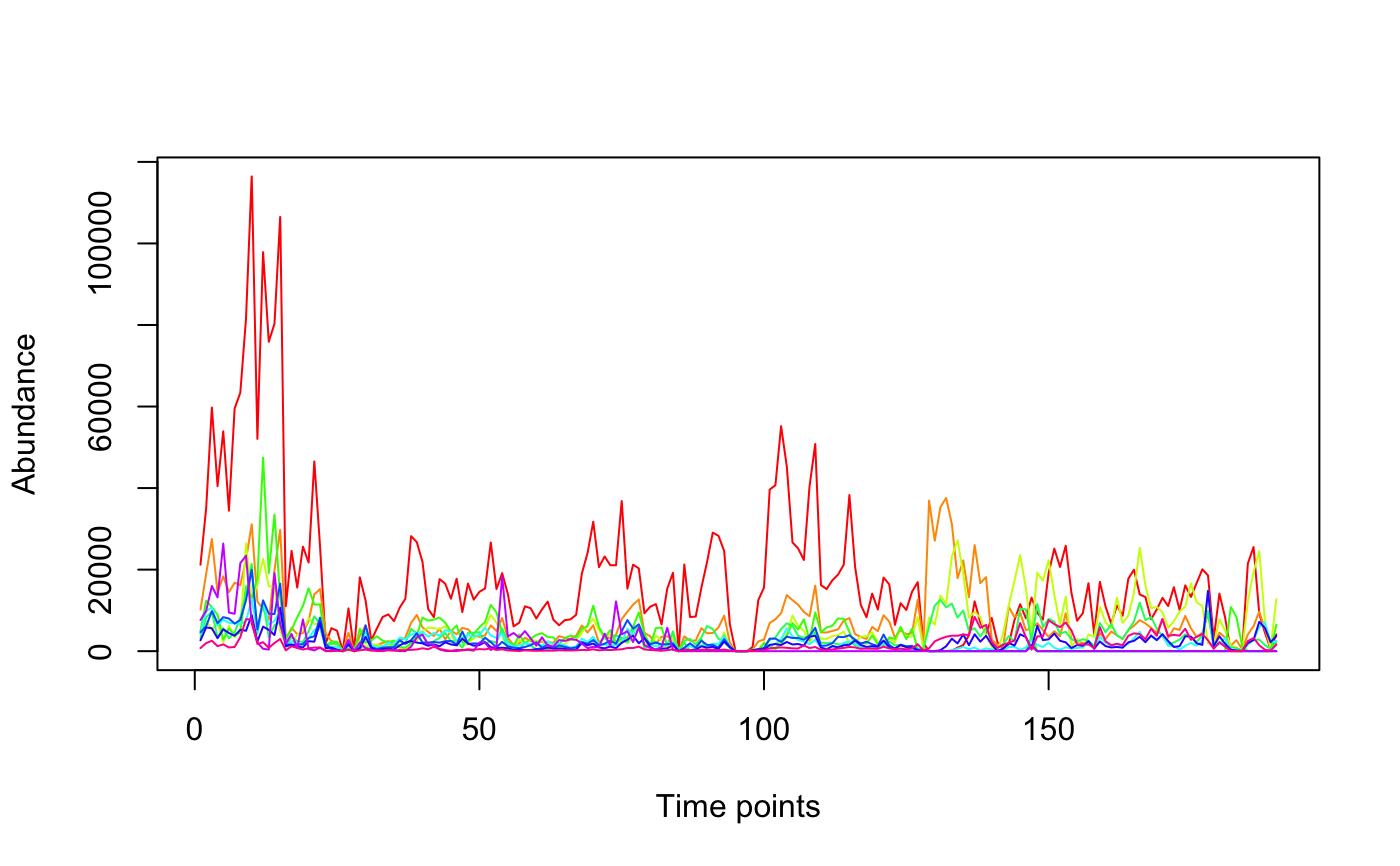
The OTUs sequenced from stool samples of subject B over time.
data(david_stoolB_otus)
Format
An object of class data.frame with 5431 rows and 190 columns.
Value
#' @return OTUxSample matrix of size 5431 x 190
Details
Salmonella infection (food poisoning) peaked at day 159.
References
David et al. (2014) Host lifestyle affects human microbiota on daily timescales Genome Biology vol. 15 (7):R89 Genome Biology
Examples
data(david_stoolB_otus)
# Sort OTUs by abundance
sorted <- sort(apply(david_stoolB_otus,1,sum),
                 decreasing=TRUE,index.return=TRUE)
# Display the top 10 most abundant OTUs
tsplot(david_stoolB_otus[sorted$ix[1:10],], header = "Stool B")#> Warning: "header" is not a graphical parameter#> Warning: "header" is not a graphical parameter#> Warning: "header" is not a graphical parameter#> Warning: "header" is not a graphical parameter#> Warning: "header" is not a graphical parameter#> Warning: "header" is not a graphical parameter#> Warning: "header" is not a graphical parameter#> Warning: "header" is not a graphical parameter#> Warning: "header" is not a graphical parameter#> Warning: "header" is not a graphical parameter#> Warning: "header" is not a graphical parameter#> Warning: "header" is not a graphical parameter#> Warning: "header" is not a graphical parameter#> Warning: "header" is not a graphical parameter#> Warning: "header" is not a graphical parameter