The OTUs sequenced from stool samples of subject A over time.
data(david_stoolA_otus)
Format
An object of class data.frame with 5431 rows and 329 columns.
Value
OTUxSample matrix of size 5431 x 329.
Details
Subject A traveled from day 71 to day 122 and contracted diarrhea on days 80 to 85 and 104 to 113.
References
David et al. (2014) Host lifestyle affects human microbiota on daily timescales Genome Biology vol. 15 (7):R89 Genome Biology
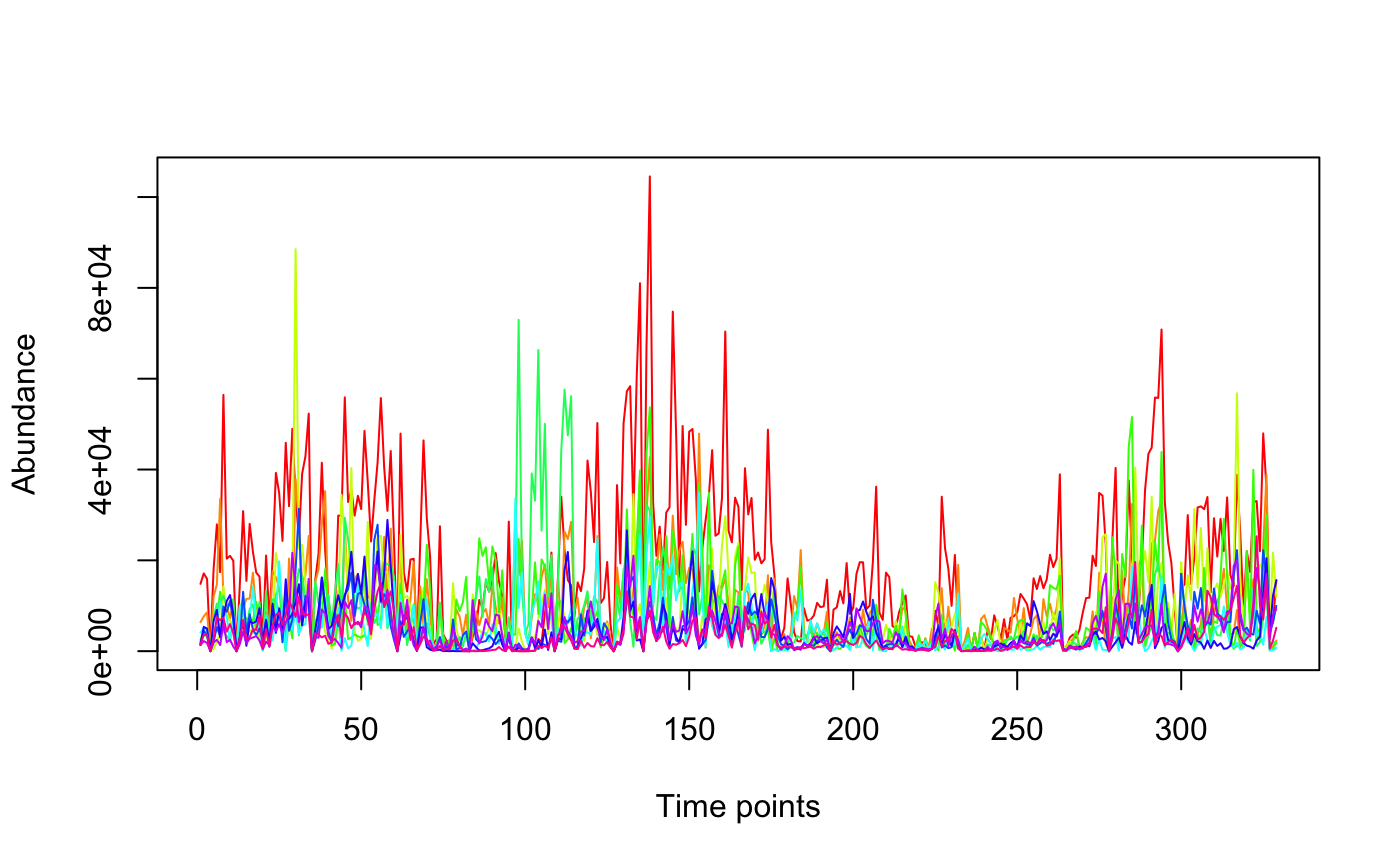
Examples
data(david_stoolA_otus)
  # sort OTUs by abundance
  sorted <- sort(apply(david_stoolA_otus,1,sum),
                 decreasing = TRUE, index.return = TRUE)
# display the top 10 most abundant OTUs
tsplot(david_stoolA_otus[sorted$ix[1:10],], header = "Stool A")#> Warning: "header" is not a graphical parameter#> Warning: "header" is not a graphical parameter#> Warning: "header" is not a graphical parameter#> Warning: "header" is not a graphical parameter#> Warning: "header" is not a graphical parameter#> Warning: "header" is not a graphical parameter#> Warning: "header" is not a graphical parameter#> Warning: "header" is not a graphical parameter#> Warning: "header" is not a graphical parameter#> Warning: "header" is not a graphical parameter#> Warning: "header" is not a graphical parameter#> Warning: "header" is not a graphical parameter#> Warning: "header" is not a graphical parameter#> Warning: "header" is not a graphical parameter#> Warning: "header" is not a graphical parameter