Compute transition probabilities between clusters
transitionProbabs.RdThe cluster vector assigns to each sample its cluster membership. If samples are in temporal order, transition probabilities between clusters can be computed. A group membership vector can be optionally provided to prevent computation of transitions between different groups. This is useful when time series were collected for several related experiments (e.g. study participants). The order of samples in the cluster and group membership vectors is supposed to be the same. If logodds is true, the log ratio between the observed and expected transition probability is computed, where the latter is the product of the prior probabilities for the two clusters. A log ratio above 1 or below -1 means that observed transition probabilities are greater or smaller than expected at random. If a binary metadata item is provided, the function counts how often transitions occur within a sliding window with and without a metadata change. In this case, two matrices are returned: one with transition frequencies in the presence of a metadata change and one with transition frequencies in the absence of that change. In this case, intra-cluster transitions are not counted. Note that within the window, temporal order between metadata and cluster change is not enforced (so the cluster may change before the metadata changes).
transitionProbabs(
  clus.vec = c(),
  groups = c(),
  metadata.vec = c(),
  windowSize = 4,
  freq = FALSE,
  logodds = FALSE
)
Arguments
| clus.vec | the vector with cluster memberships |
|---|---|
| groups | an optional vector with group memberships |
| metadata.vec | an optional binary metadata item |
| windowSize | in case metadata are provided: the size of the sliding window |
| freq | if true, transition frequencies instead of probabilities are returned (for metadata.vec, always true) |
| logodds | if true, compute logarithm of the ratio of the observed and the expected transition probability |
Value
a matrix or, if metadata.vec provided, a list with 2 matrices, the first without metadata change and the second with metadata change
Examples
# generate random cluster memberships
clus.vec=round(runif(100,min=1,max=5))
trans.mat=transitionProbabs(clus.vec)
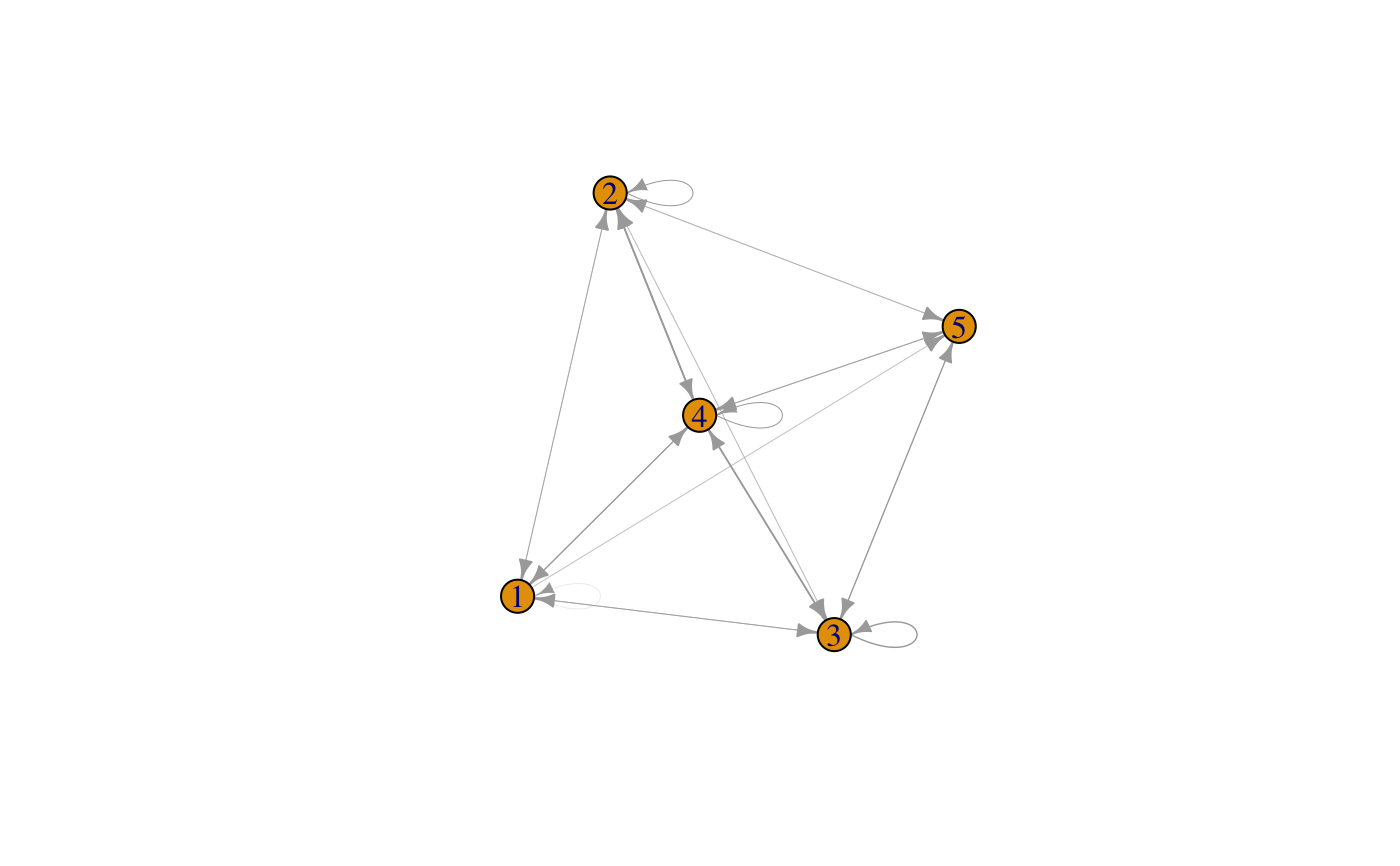
# display transition matrix as a network with igraph
gr=graph_from_adjacency_matrix(trans.mat,mode="directed",weighted = TRUE)
# plot graph with transition probabilities as edge thickness
edge.weights=as.vector(t(trans.mat))
edge.weights=edge.weights[edge.weights>0]
plot(gr,edge.width=edge.weights*10) # 10 is a factor to scale edge weights, may have to be adjusted
