Compare diversity-related properties across groups
compareGroups.RdThe function allows to compare richness, evenness, alpha diversity and beta diversity across groups, where beta diversity can be assessed with both a Bray Curtis distribution or overdispersion from a Dirichlet-Multinomial distribution fit. By default, groups are subsampled to the same sample number, for this reason the output of the same run can differ. To switch off this behaviour, subsample can be set to false. Chao1 and Shannon diversity are computed with vegan.
compareGroups(
  abundances,
  property = "beta",
  method = "dissim",
  groups = c(),
  colors = c(),
  colorMap = NULL,
  plot.type = "pergroup",
  avg = "none",
  all = FALSE,
  noSameGroup = TRUE,
  rowNorm = FALSE,
  subsample = TRUE,
  xlab = "",
  pvalViz = FALSE,
  returnValues = FALSE
)
Arguments
| abundances | a matrix with taxa as rows and samples as columns |
|---|---|
| property | richness (Chao1), evenness (Sheldon), alpha (alpha-diversity with Shannon index) or beta (beta-diversity) |
| method | for beta-diversity, dissim (Bray Curtis dissimilarities) and DM (estimation of theta with package dirmult) are supported |
| groups | group membership vector with as many entries as samples in abundances |
| colors | optional color vector with as many entries as (unique) groups (only for plot.type pergroup) |
| colorMap | optional color map with a color for a metadata value, required for color legend (only for plot.type pergroup) |
| plot.type | pergroup (plot property per group; this is the only plot type available for richness, evenness, alpha and beta with DM) and intravsinter (plot property for all within-group samples versus all samples) |
| avg | none, mean or median (average group property with the selected averaging method, does not work for method DM) |
| all | include the beta diversity for all samples |
| noSameGroup | for beta diversity with method dissim: only between-group pairs are used to calculate the beta diversity for all samples |
| rowNorm | for beta diversity with method dissim: normalize the abundances row-wise |
| subsample | subsample groups randomly to have the same sample number in each group; for plot type intravsinter, it equalises in additon the number of pairs within and between groups |
| xlab | the x axis label |
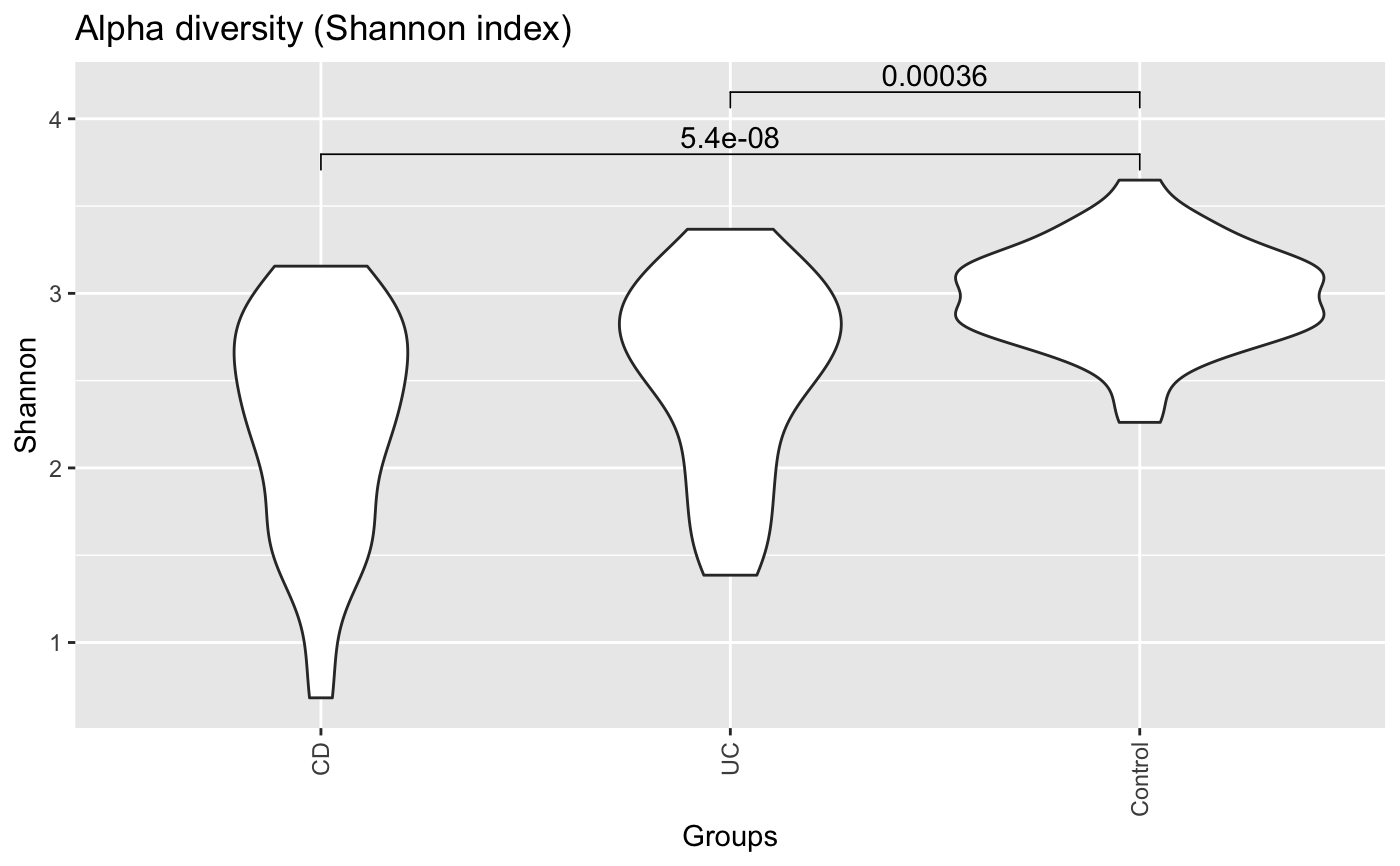
| pvalViz | if true and avg is set to none and plot.type is pergroup, significant Wilcoxon p-values are displayed on the violin plot using function stat_compare_means in R package ggpubr |
| returnValues | if true, return properties |
Value
if returnValues is true, properties are returned
Examples
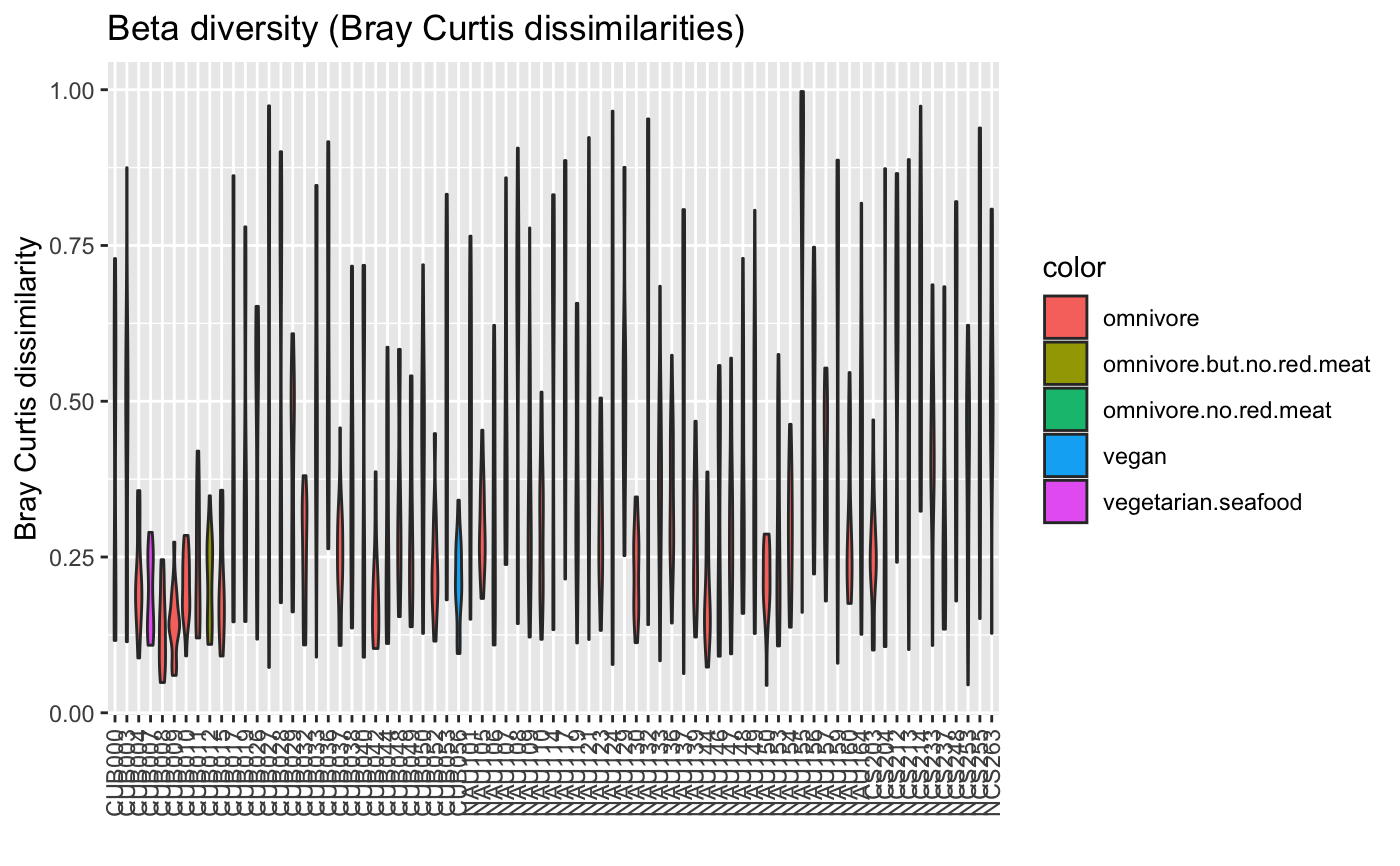
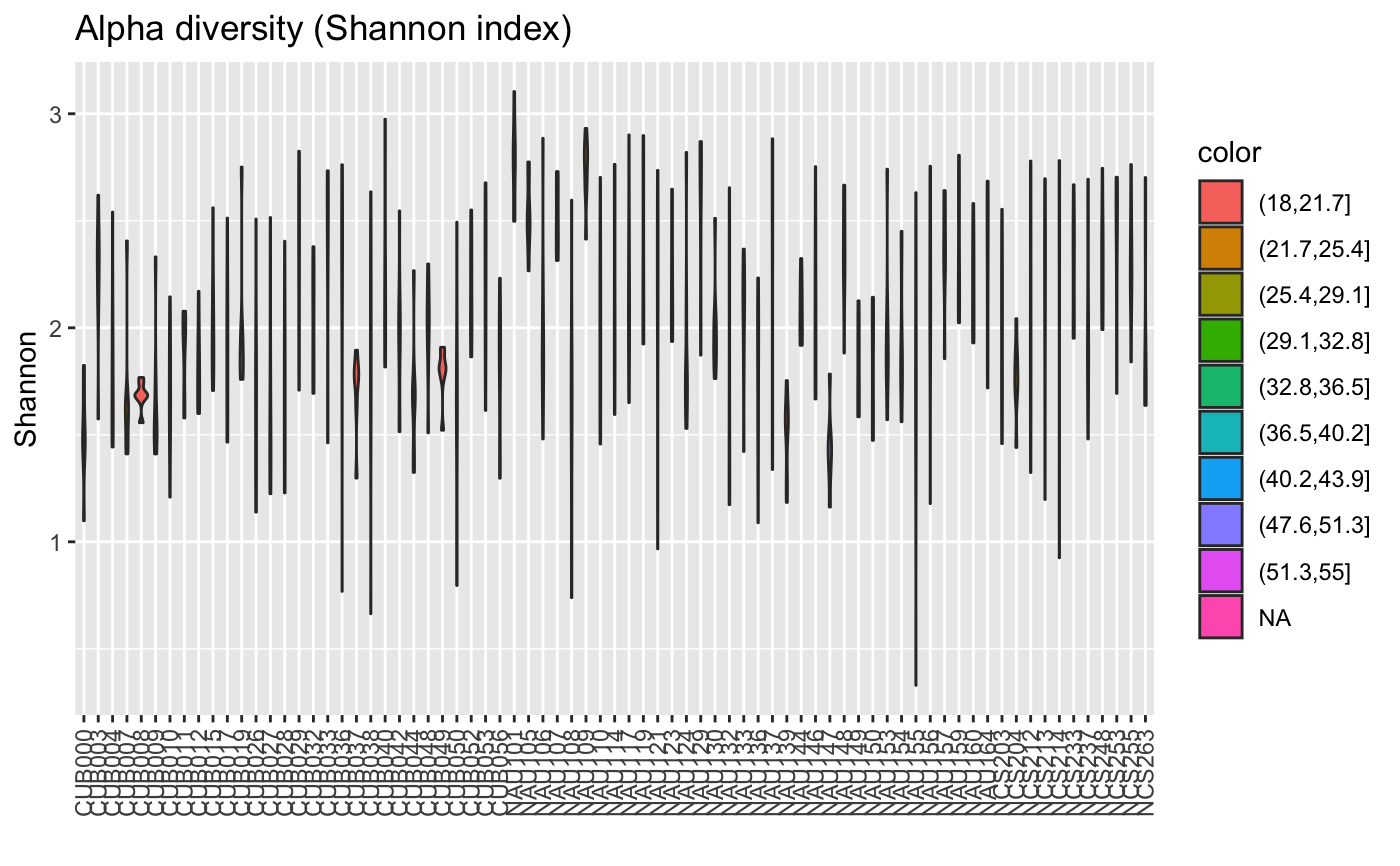
data("ibd_taxa") data("ibd_metadata") groups=as.vector(ibd_metadata$Diagnosis) compareGroups(ibd_taxa,groups=groups,property="alpha",pvalViz = TRUE)#> [1] "Constraining sample number randomly to the same minimal group sample number of 34" #> [1] "Number of significant differences in property alpha across groups: 2"#>data("floresgut_taxa") data("floresgut_metadata") groups=floresgut_metadata$host_subject_id diet.col=makeColorsGivenMetadata(metadataItem=floresgut_metadata$diet,groups=groups)#> [1] "Each sample is assigned into its own bin."compareGroups(floresgut_taxa,groups=groups,colors=diet.col$colors,colorMap=diet.col$colormap)#> [1] "Constraining sample number randomly to the same minimal group sample number of 7"#>age=floresgut_metadata$age age.col=makeColorsGivenMetadata(metadataItem=age,groups=groups,binning="equaldist",numBins=10)#> [1] "Metadata item is numeric." #> [1] "Thresholds equaldist binning:" #> [1] "(18,21.7]" "(21.7,25.4]" "(25.4,29.1]" "(29.1,32.8]" "(32.8,36.5]" #> [6] "(36.5,40.2]" "(40.2,43.9]" "(43.9,47.6]" "(47.6,51.3]" "(51.3,55]" #> [1] "21 missing values found."col=age.col$colors compareGroups(floresgut_taxa,groups=groups,property="alpha",colors=col,colorMap=age.col$colormap)#> [1] "Constraining sample number randomly to the same minimal group sample number of 7"#>