Compare the distribution of a taxon across two groups
compareDistribs.RdPlot taxon abundances as histograms and calculate the unpaired two-sided Wilcoxon p-value.
compareDistribs(
  x,
  taxon,
  groups = c(),
  group1 = 1,
  group2 = 2,
  name1 = as.character(group1),
  name2 = as.character(group2)
)
Arguments
| x | a matrix with taxa as rows and samples as columns |
|---|---|
| taxon | the index or name of a taxon to be compared |
| groups | a vector that provides for each sample its group membership (numeric or character) |
| group1 | the identifier of the first group (numeric or character) |
| group2 | the identifier of the second group (numeric or character) |
| name1 | the name to be displayed for the first group |
| name2 | the name to be displayed for the second group |
Examples
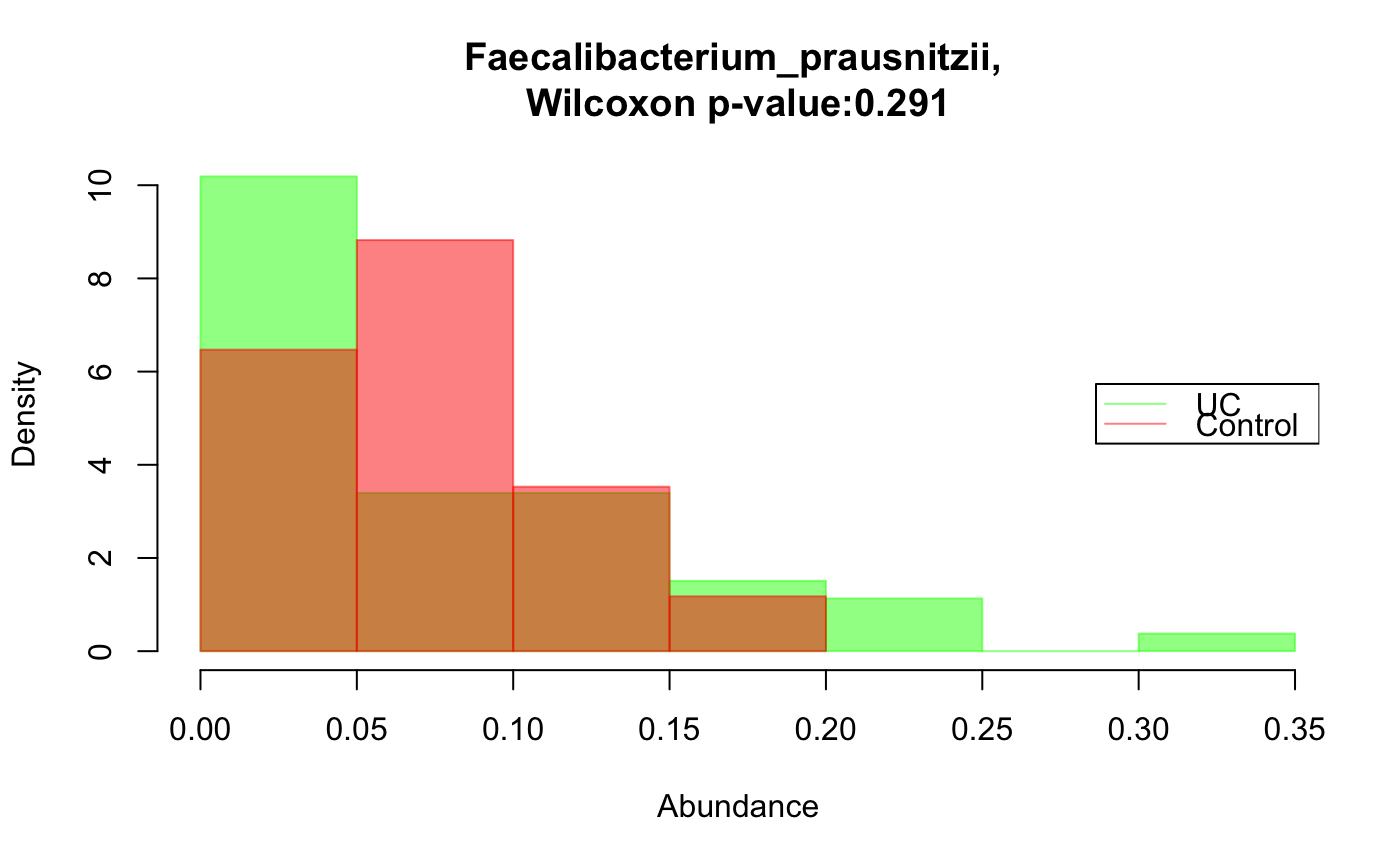
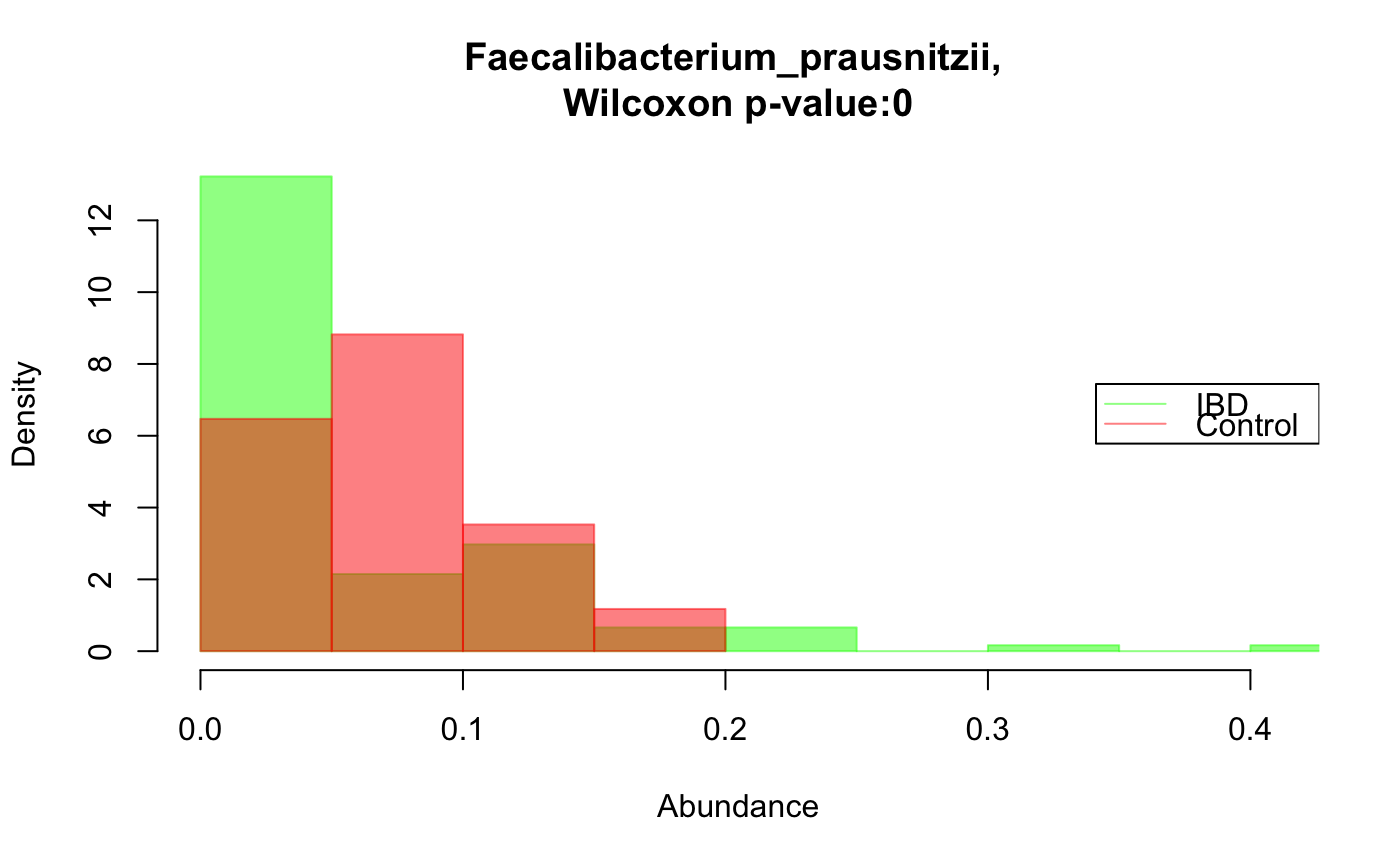
data("ibd_taxa")
data("ibd_metadata")
groups=as.vector(ibd_metadata$Diagnosis)
taxon="Faecalibacterium_prausnitzii"
compareDistribs(ibd_taxa,taxon=taxon,groups=groups,group1="UC",group2="Control")groups[groups=="UC"]="IBD"
groups[groups=="CD"]="IBD"
# Faecalibacterium has a significantly higher relative abundance in the control group
compareDistribs(ibd_taxa,taxon=taxon,groups=groups,group1="IBD",group2="Control")